
Belief Cartography: Turning LLM Product Intuitions into an Experiment Portfolio
An LLM can read your users' event streams and tell you what to build next. It will also invent an opportunity for every user it has ever seen. Both facts matter.
TL;DR
- The method: elicit an LLM judge's beliefs (journey → intervention → believed lift) over user-journey space, smooth them into a map, and treat high believed-lift × high-density regions as an experiment portfolio — never as estimates.
- Judge priors are real: 65–67% directional accuracy and ρ ≈ 0.36 against 500 real Upworthy A/B tests — where 2024-era models scored near-random. Any “LLMs can't predict experiments” conclusion has a model-generation expiry date.
- The judge never says no: across four evaluations, it proposed a positive-lift intervention for 100% of visibly-thriving users (0/110 students, 0/14 healthy accounts got “none”). Unaudited LLM opportunity maps are folklore atlases.
- Use rankings, settle with experiments, and check heterogeneity first: judges can't size effects (magnitude ρ ≈ 0.13), and a map of a flat opportunity surface is worthless by construction.
The idea
Every product team sits on event streams that nobody fully reads: clickstreams, usage logs, support touches. And every team has a backlog of intervention ideas ranked mostly by whoever argued best in the planning meeting. The tempting shortcut is to ask an LLM to do both jobs — read each user's journey, describe where they are, propose the intervention with the highest expected value, and estimate the customer's lifetime value in the current world and in the counterfactual world where the intervention ships.
Taken literally, that shortcut is unsound. The judge has no identification: there is no data from the counterfactual regime, so both “estimates” are fabrications, and their difference — the lift — is a difference of two hallucinations. But there is a sound version, and it needs only one reframe: the pipeline's output is a map of the judge's beliefs, not a map of reality. Beliefs are cheap to elicit at scale, they turn out to correlate with real experimental outcomes, and a belief surface over user-journey space is exactly the right prior for deciding which experiments to run first.
Elicit
For each user journey (raw event log), the judge outputs: a description, a proposed intervention, believed lift, and confidence. One cheap model call per user.
Amortize
Embed journeys, smooth believed lift over the embedding (kNN). The judge is a pointwise belief oracle; smoothing turns discrete queries into a continuous surface you can optimize on.
Prioritize
Score regions by believed lift x population density. Extract exemplars from top regions; have the judge articulate the common thread against hard negatives.
Settle
The ranked regions are an experiment portfolio. Run segment-level experiments with the judge ranking as a prior (levels calibrated from historical effect sizes, never from the judge). Experiments are the settlement layer.
The one-sentence version: structured elicitation of an LLM's beliefs into a surrogate objective over user-journey space, optimized under population density, and settled by experiment. We spent one day and $22.74 of API calls stress-testing every clause of that sentence — one simulation with known ground truth, one synthetic pilot with planted archetypes, and two real datasets: 500 experiments from the Upworthy Research Archive and 220 student journeys with realized outcomes from OULAD.
How good does the judge have to be?
Before touching real data, we built a world where we control everything: a 2D journey space with a mixture-of-Gaussians population, planted opportunity pockets (a real winner in a dense region, a hidden gem in a sparse one), and — crucially — a folklore bump: a region where the judge believes there is value and there is none, planted in the densest segment, because that is exactly where LLM tropes live. The judge's beliefs mix truth, folklore, systematic error, and query noise; a knob sets how correlated its region ranking is with reality.
The pipeline then plays a sequential game: partition users into regions, take the judge's believed-lift ranking as a Bayesian prior (location and scale calibrated from “historical” effect sizes — the judge supplies ranking only), and allocate a budget of eight segment-level experiments by upper confidence bound. The question: how correlated does the judge's ranking have to be with truth before this beats not having a judge at all?
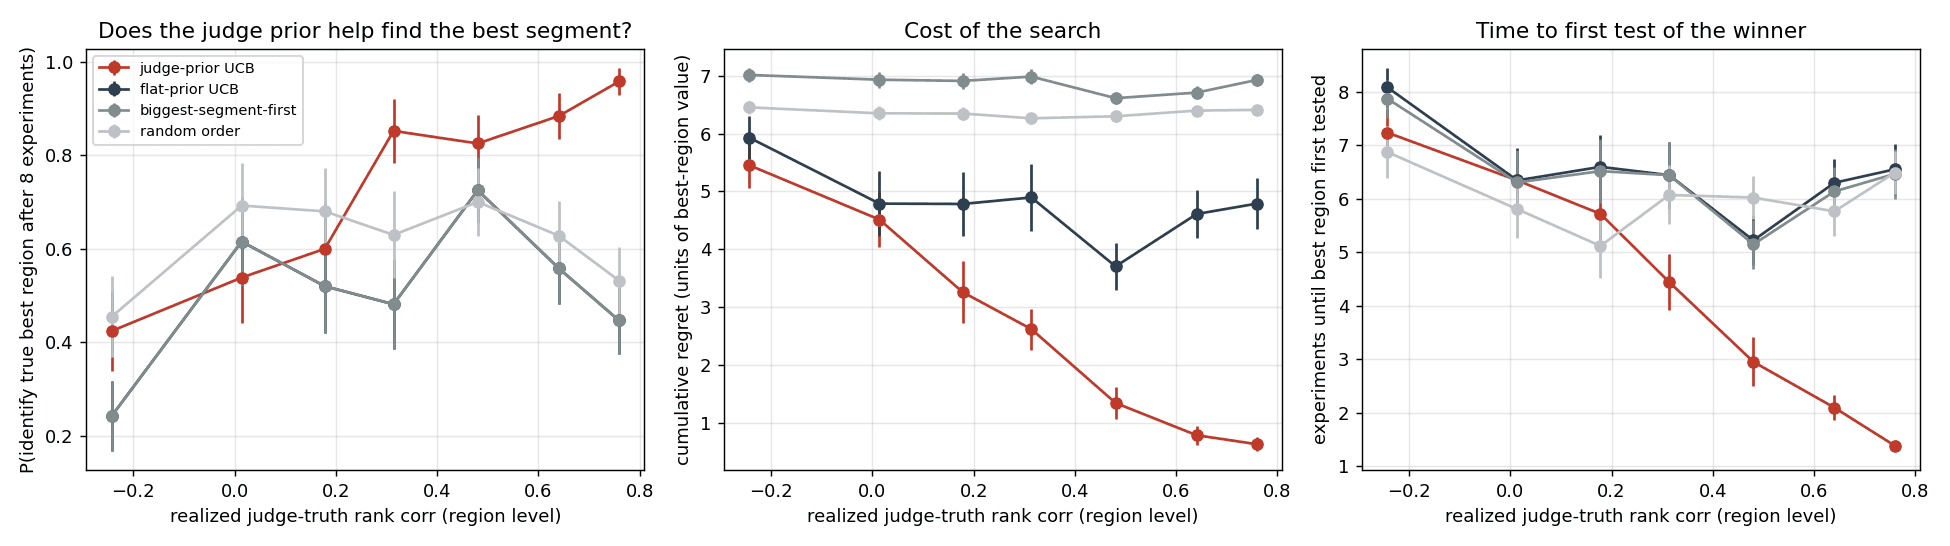
The answer is: not very good. The break-even sits around rank correlation ρ ≈ 0.15–0.2. A mediocre judge (ρ between 0.15 and 0.45) finds the true best segment 79% of the time versus 56% for the same adaptive search without the prior, and roughly halves cumulative regret. A good judge finds the winner in about 2 experiments instead of 6. And the downside is tiny: because the prior carries only a ranking and the experiments keep arbitrating, even a useless judge costs almost nothing — the loop washes it out. Asymmetric payoff: that is the strongest structural argument for the method.
One caveat the simulation taught us that we only appreciated later: the wash-out guarantee depends on experiments being informative. Segment-level experiments aggregate many users and produce tight estimates; if your “experiments” reveal one noisy observation at a time, a wrong prior stands for a long time.
Are LLM priors real? 500 actual A/B tests
The load-bearing premise is that judge beliefs correlate with real experimental outcomes. The Upworthy Research Archive — 32,487 real headline A/B tests from 2013–2015 — lets us measure that directly. We selected 500 well-powered tests (same image across arms so the headline is the isolated treatment, |z| ≥ 2 so the ground-truth direction is reliable, presentation order randomized), showed the judge both headlines, and asked it to predict the winner and the relative CTR lift.
- Haiku: 65.2% ± 4.2% directional accuracy (chance is 50%), signed believed-vs-realized lift Spearman 0.36. Sonnet on a 100-test subset: 67%, ρ = 0.35.
- Confidence is informative: accuracy rises from 45% in the lowest-confidence bin to 73% in the highest. Re-asking the same question five times is informative too: on pairs where the judge flips its answer across resamples, error rates are 50% versus 33% on stable pairs.
- Magnitude is not: the judge's ability to rank gap sizes (direction-free) is weak, ρ ≈ 0.13–0.19. Judges rank winners; they cannot size effects. Take rankings, never levels — the same conclusion CJE reaches for policy evaluation.
- No contamination detected: accuracy is flat across test-prominence quartiles, and a completion probe found zero near-verbatim recall on deployed and never-deployed headlines alike.
- But watch for position bias: the judge picked the second-presented headline 60% of the time regardless of content (accuracy 55% when the winner sat in slot A vs 76% in slot B). Our order randomization keeps the aggregate honest, but single-order querying leaves accuracy on the table — in deployment, query both orders and average.
Context makes the 65% more interesting than it looks. The LOLA paper ran essentially this evaluation on the same corpus in 2024: GPT-3.5 performed at chance and GPT-4 only marginally better. Today's cheapest frontier-lab model clears the simulation's break-even with room to spare, at roughly $0.01 per judgment. Every negative result of the form “LLMs can't predict experiments” carries a model-generation expiry date, and several have already expired.
The judge never says no
Here is the failure mode that makes the settlement layer non-optional. Across every dataset we tested, the judge proposed a positive-lift intervention for essentially every entity it saw — including the ones doing great:
- In a synthetic SaaS pilot with planted ground truth, 0 of 14 healthy accounts got “none” — and the healthy cluster ranked #2 on believed total value ($10.8k believed; $350 planted).
- On 220 real OULAD student journeys, 0 of 110 observably-thriving students (all assessments submitted, scores ≥70, consistently active) got “none.” Mean believed gain on these students: +16.7 percentage points of completion probability — including the 87 who went on to finish well with no intervention at all.
- Folklore shows up at cluster level too: a “silent dropout risk — post-assessment cliff” segment carried one of the highest believed gains, while its realized bad-outcome rate (0.29) was below the population base rate (0.42). The trope reads as danger; the reality is benign coasting.
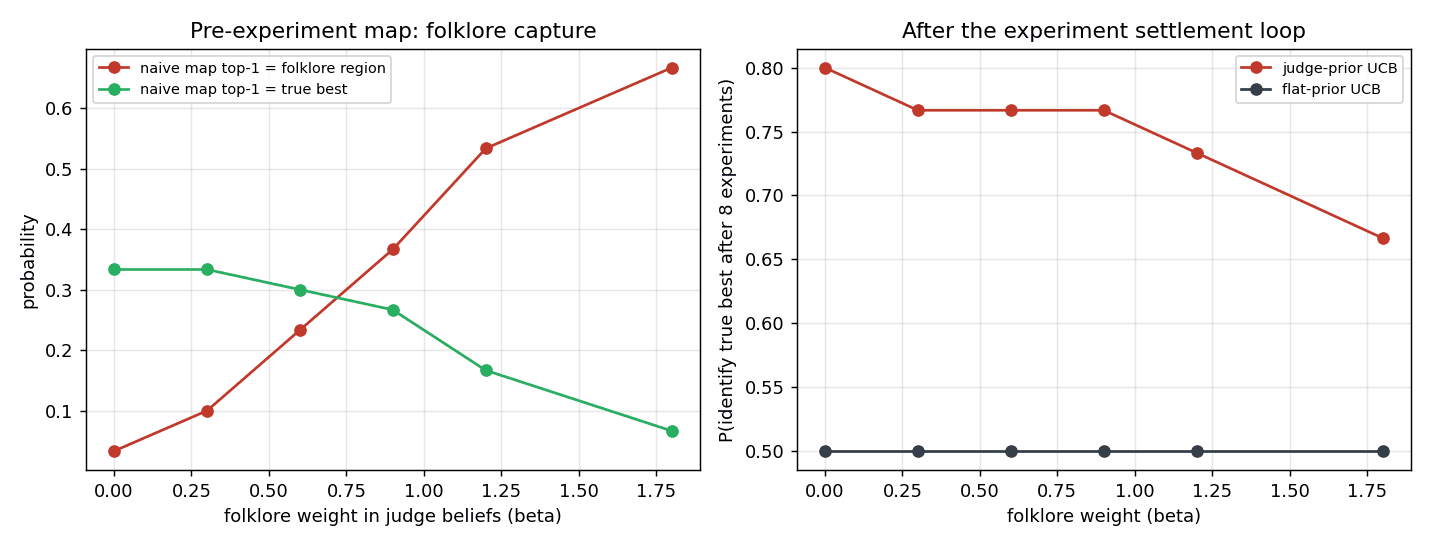
This is not a prompt bug; it is what a helpful assistant trained on product-advice text is. In the simulation, once folklore gets moderately strong, the naive believed-lift × density map picks the folklore region as its top opportunity 60% of the time. An unaudited LLM opportunity map is a confident, legible, well-written atlas of product folklore. The experiments are what turn it into causal knowledge — and in the simulation, two to three segment-level experiments are enough to correct it.
What else broke (and what it teaches)
Three more results from the real-data rounds, all of which sharpened the method's boundaries:
1. A map of a flat surface is worthless. We replayed the full cartography loop on Upworthy: cluster the content space, aggregate judge beliefs per region, run the prior-guided experiment loop against real archived outcomes. It did not beat a flat prior — because Upworthy's opportunity surface is nearly flat. Mean realized lift varies between content regions by only 0.16 while varying within regions by 0.87; the top two regions sit within 5% of each other. When every region pays about the same, there is nothing for a map to find, and any mass-aware adaptive method captures ~97% of achievable value. Measure opportunity heterogeneity across segments before building any map. Product journey-space tends to be heterogeneous (our pilot's planted spread: $0 to $28k per segment); content-style spaces may not be.
2. Reading is not the edge. On OULAD, the judge's withdrawal-risk predictions from raw logs are genuinely calibrated (AUC 0.715; predicted-risk bins realize monotonically: 0.26 / 0.52 / 0.80). They are also strictly dominated by a five-feature logistic regression (AUC 0.839), and add nothing on top of it (0.841). Where the signal is legible in simple counts, a boring model beats the judge at prediction. The judge's unique contribution is upstream and downstream of prediction: generating the segment × intervention hypotheses and articulating them — which is precisely the part observational data cannot verify. That verification requires experiments.
3. Explanations confabulate — and the audit catches it. When we asked the judge to articulate the common thread of a top segment against easy contrast examples, it produced a rule that overfit to exemplar constants (“12–14 seats, $588–686 MRR”) and classified held-out members barely above chance (8/12, in-cluster recall 2/6). Re-run with hard negatives (nearest out-of-cluster neighbors) and an explicit no-constants instruction: a scale-free behavioral rule whose in-cluster recall went to 6/6 (the held-out negatives were easy in both versions — we quote the recall, not a 12/12). On real OULAD clusters — which are fuzzier (silhouette 0.06) — the same audit scored 9/12, and the rule it produced is the kind of thing a product team can actually ship against: “scored well early, still engaged, but missed the first high-stakes assignment — a motivational gap, not a skill gap → timed nudge plus a no-penalty extension.” Validate every narrative as a classifier before it goes in a deck.
The audit stack
If you build any version of this — and several teams are quietly building exactly this — the audits are not optional hygiene. They are what separates a prioritization engine from a mythology generator:
Ranking audit against history
Blind the judge to outcomes of past experiments; measure rank correlation with realized lifts. That single number tells you (via the operating curves) how many experiments the prior will save. Below ~0.15, the map is decoration.
Heterogeneity check
Estimate the between-segment spread of realized (or plausible) lift relative to within-segment variance. Flat surface: skip the map, run adaptive experiments weighted by audience size.
Folklore audit
Feed the judge entities that are objectively fine. Count how often it says "none." (In our runs: never.) Any believed lift on thriving segments is your folklore floor — subtract it mentally from every map region.
Never trust magnitudes
Use believed-lift rankings only; calibrate prior location and scale from historical effect sizes. Judge-quoted dollar or percentage-point gains are not estimates.
Uncertainty via resampling — on the right scale
Re-query each journey several times. Winner flips and unanchored-scale variance predicted errors in our runs; anchored probability outputs compressed variance until no signal survived (small-n caveat: 10 resampled journeys). Prefer discrete or comparative outputs for this audit.
Hard-negative rule validation
Explanations of segments must be articulated against nearest non-members and validated as classifiers on held-out entities. Easy contrast sets produce confident overfit narratives.
Relation to prior work
The pieces adjacent to this have real literatures. LOLA combines LLM predictions with bandits to allocate traffic among given content variants — the settlement half of this method, in production. A recent surrogacy framework for LLM-based A/B testing gives identification conditions for calibrating LLM outputs to human treatment effects (raw outputs recover ~39% of the effect on Upworthy; calibration closes the gap) — the rigorous measurement-side complement to our deliberately weaker ranking-only requirement. LLM forecasting of field experiments shows domain-dependent skill (78% directional accuracy on economics experiments, with systematic failures on sensitive social domains) — reinforcing per-domain ranking audits. The text-as-data causal inference literature (Egami et al.; Feder et al.) covers the LLM-as-measurement role for observational settings. What we have not seen claimed: eliciting beliefs over user-journey space from observational logs to generate segment × intervention hypotheses, density-weighted into an experiment portfolio, with the audit stack as a first-class part of the method. That strip is what this post stakes out.
When to use this (and when not to)
| Situation | Verdict |
|---|---|
| Rich behavioral logs, heterogeneous segments, capacity to run segment-level experiments | Use it. Judge priors cut experiments-to-winner ~2–3× at current model fidelity; downside is bounded by the settlement loop. |
| Choosing among a handful of pre-written variants for one audience | Skip the map — use LLM-prior bandits directly (LOLA). There is no journey space to cartograph. |
| Opportunity surface is flat across segments (check first!) | Skip the map — adaptive experimentation weighted by audience size captures ~97% of value on its own. |
| Pure outcome prediction (churn risk, conversion propensity) | Use boring features and a boring model — it beat the judge (AUC 0.839 vs 0.715). The judge is for hypothesis generation, not prediction. |
| No ability to run experiments at all | Do not deploy the map as truth. Best defensible role: LLM as measurement device for text-as-treatment causal inference on natural variation. |
Reproducibility & what's next
Everything above ran in one day on public data: the Upworthy exploratory split (respecting the archive's exploratory/confirmatory protocol) and OULAD, with Claude Haiku 4.5 as the workhorse judge and Sonnet for the model-gradient subset and thread articulation. Total model spend: $22.74. The one claim public data cannot settle is the one that matters most commercially: whether the judge's generated interventions beat a product team's backlog when both are tested. That requires a partner with real journeys and a real experiment pipeline. If that's you, get in touch.